Technical Analysis Making Strong Bearish Case for the U.S. Dollar
Be very careful if you live in the United States. The value of the U.S. dollar could be setting up to break below 2008 lows, and it could have dire consequences. A major economic slowdown could just be one side effect.
It’s not just the fundamentals making a strong bearish case for the dollar; technical analysis suggests the same.
Advertisement

First, look at the daily chart of the U.S. dollar index below. This index tracks the performance of the dollar relative to major currencies.
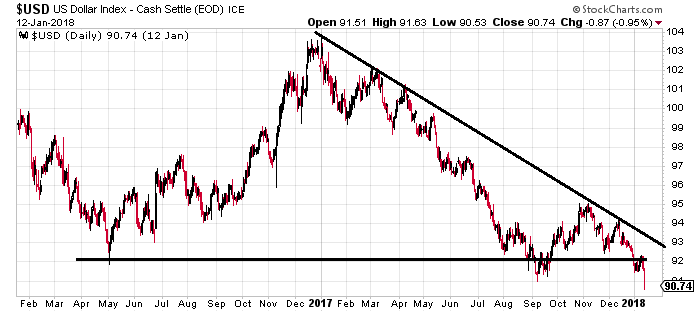
Chart courtesy of StockCharts.com
There are two things that must be noticed on the chart above:
- Since early 2017, the U.S. dollar has been trending downward. With this, remember the most basic rule of economic analysis: the trend is your friend until it’s broken. In other words, the downtrend could remain in place for a while.
- Pay close attention to the two lines drawn on the chart.
You see, over the last one-and-a-half years, the U.S. dollar index was forming a chart pattern called a “descending triangle.” This pattern is formed when price finds support but there’s also a persistent downtrend in place.
Once the price breaks below the support level, you have a breakout in place. We just saw that happen on the U.S. dollar chart over the last few weeks. The price broke below the support level.
Now, know this: for every chart pattern, there are usually targets associated with them. With a descending triangle, technical analysts take the widest part of the triangle and subtract it from the breakout point.
Let’s assume the breakout point on the U.S. dollar index at $92.00. If we assume that the widest part of the triangle is the move between May 2016 and January 2017, it’s roughly $11.00 wide.
So, if we subtract $11.00 from $92.00, we could see the U.S. dollar index drop to around $81.00.
40-Year U.S. Dollar Chart Says Massive Declines Ahead
But look at the 40-year chart of the U.S. dollar index: it shows that the downside could be much bigger.
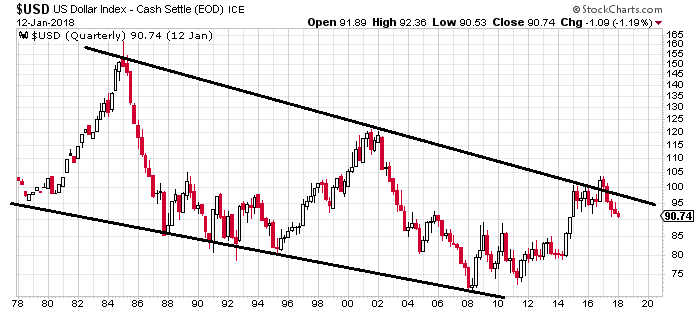
Chart courtesy of StockCharts.com
Over the last 40 years, the U.S. dollar has been trading in a downward channel. It has been making consecutive lower highs and lower lows, with resistance to the upside and support at the bottom. In the chart above, it’s very evident.
In late 2016 and early 2017, the dollar hit the upper resistance level. Now, the price is breaking lower from it. If this channel persists, understand that the next support level for the U.S. dollar isn’t until around the $60.00 area—that’s well below where the U.S. dollar was in the midst of the financial crisis of 2008 and 2009.
What Happens If the Dollar Plummets?
Dear reader, if the U.S. dollar plunges in value and you are living in the U.S., you would find things getting expensive all of a sudden. A depreciating dollar could impact the buying power of Americans immensely. This hurts consumer confidence, business confidence, and the list goes on.
In simple words, don’t be shocked if the decline in the greenback causes the next recession in the U.S. economy.
Beyond all this, I continue to see a solid opportunity in gold prices. It’s one of the best hedges against the dollar and is still selling for rock-bottom prices.